AWS Network Firewall now supports rule hit count
August 20, 2026 · AWS Security · Severity: MEDIUM
AWS Network Firewall now supports rule hit count, allowing security teams to identify which firewall rules are actively matching traffic. This feature helps teams optimize firewall rule sets by identifying rules that consume capacity without matching traffic. The rule hit count feature supports compliance frameworks like PCI 4.0 and DORA by providing evidence of specific control effectiveness. Security teams can use this data to reduce noise and improve firewall performance.
As firewall rule sets grow in complexity, security teams face a common challenge: manual log analysis is used to determine which rules are actively matching traffic and which are consuming capacity without being triggered. This lack of visibility creates operational and compliance gaps. Organizations with governance policies that require removal of dormant rules after a defined period have no mechanism to identify them. Teams responsible for compliance frameworks such as Payment Card Industry (PCI) 4.0 and Digital Operational Resilience Act (DORA) can’t provide evidence that specific controls are actively functioning. Central teams managing firewalls on behalf of multiple business units have no way to determine which rules are unused or need updating.
In this post, you learn how a new AWS Network Firewall capability—rule hit count—addresses these challenges by providing traffic match data for stateful rules across both custom and managed rule groups. With this data, you can identify and remove unused rules, accelerate incident response, and validate security control effectiveness for compliance.
How it works
Rule hit counts track how often each stateful rule matches network traffic. The hit counter increments only when a rule match results in an alert log being created. This means any rule with an alert, drop, or reject action will increment the hit counter, because these actions generate alert logs. However, rules configured with a pass action don’t generate alert logs by default, meaning they won’t appear in the rule hit count metric.
To gain visibility into traffic matching pass rules, you can include the alert keyword within the pass rule. This generates an alert log while still permitting the traffic to its intended destination. The following Suricata rule demonstrates this approach:
This rule passes HTTPS traffic to its destination while also generating an alert log, making sure the rule appears in the hit count metric.
The rule hit count feature adds the following metadata to each alert log. Metadata is included by default and doesn’t require additional configuration:
“aws_metadata": { “resource_arn": “arn:aws:network-firewall:us-east-1:123456789012:stateful-rulegroup/StatefulRuleGroup” }
The following example shows a complete alert log with this metadata included:
The alert log data in the preceding example is the source for rule hit count metrics. Network Firewall pushes these alert logs to your Amazon CloudWatch Logs or Amazon Simple Storage Service (Amazon S3). To identify the specific rule that generated an alert, you can search using the combination of the sid (signature ID) and resource_arn fields. The firewall monitoring dashboard uses these fields to generate hit counts for each rule, so you can review rule activity directly on the dashboard without querying logs.
You can also access and analyze this data by querying those logs directly using CloudWatch Logs Insights for logs stored in CloudWatch, or Amazon Athena for logs stored in Amazon S3.
Getting started
Network Firewall rule hit count is enabled by default, so you don’t need to perform any additional configuration to start tracking rule hits on your firewall policies. This means that as soon as you deploy your firewall rules, you can begin to monitor which rules are being triggered, helping you gain visibility into your traffic patterns and identify potential security concerns.
Prerequisites
This walkthrough requires an existing network firewall configured to inspect traffic from your Amazon Virtual Private Cloud (Amazon VPC). If you don’t have one set up yet, follow the Getting started with AWS Network Firewall guide.
Additionally, ensure the following:
- Alert log delivery must be configured: The firewall must have alert logging enabled. Note that rule hit count metadata is captured regardless of log destination; however, the native dashboard feature requires logs to be sent to CloudWatch Logs or Amazon S3.
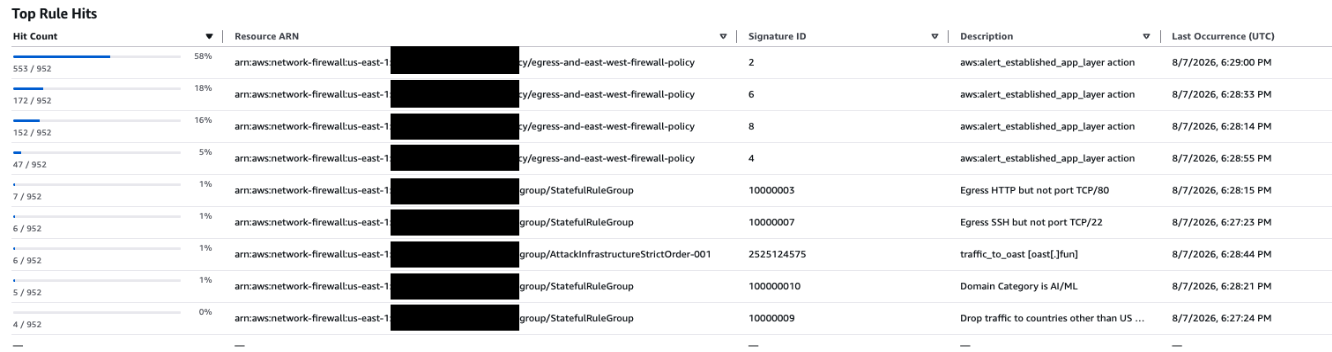
- Firewall monitoring must be enabled: To see the dashboard widget shown in figure 1, you must enable detailed monitoring through the firewall’s logging configuration or the Monitoring tab in the AWS Management Console for AWS Network Firewall. However, if you have a custom dashboard solution, the metadata required for rule hit count analysis is automatically included in the firewall logs regardless of whether detailed monitoring is enabled—so you can build your own visualizations using the log data directly.
- Pass rules must include the alert keyword to appear in hit count metrics: Rules configured with a
passaction don’t generate alert logs by default. To track pass rule activity in the hit count metric, include thealertkeyword in your pass rules, as demonstrated in the How it works section of this post.
The Top Rule Hits dashboard shows aggregated hit counts per firewall across all Availability Zones within the AWS Region where that firewall is deployed. To view rule hit count metrics, open the Network Firewall console and select your firewall. Navigate to the Monitoring and observability section. Under Top analysis, you will see the Top Rule Hits metric. Select a lookback period to view rule activity within that timeframe.
Key Takeaways
- AWS Network Firewall now supports rule hit count for identifying active firewall rules.
- The feature helps optimize rule sets by identifying rules consuming capacity without matching traffic.
- Rule hit count supports compliance frameworks like PCI 4.0 and DORA with evidence of control effectiveness.